Reading the chart card
The chart card on Today packs a lot into a small space: a solid line, a dashed line, two shaded areas, a NOW line, an amber dot with a gram count, and a chip that says LIVE, REPLAY or DEMO. Here is what each part is, and what to do when one of them puzzles you.
The parts of the card, top to bottom
Everything below is on the demo chart in our screenshots. With your own readings the shapes and numbers change, but the parts are the same.
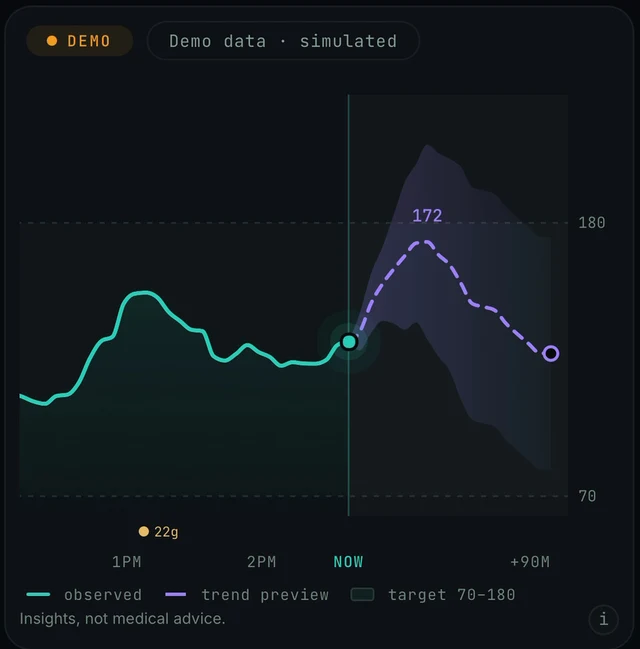
Today screen, the chart card under the NOW and forecast numbers. Demo data.
- The chip row. A chip at the top left says how fresh the data is: DEMO here, with Demo data · simulated beside it. With your own readings it reads LIVE or REPLAY. More in LIVE, REPLAY, DEMO.
- Solid teal line: observed. What your sensor recorded. It ends at the glowing dot on the vertical NOW line, which is your current reading, the same number shown beside NOW above the chart.
- Dashed purple line: trend preview. The app's view of the next hour, drawn from NOW towards the right. The number written at its peak (172 on the demo) is the same number shown beside IN 35 MIN above the chart. The small hollow circle at the end is where the preview stops. Why it moves and how much to trust it: The forecast and the Confidence score.
- Faint box between the dashed 70 and 180 lines: the target band. The legend calls it target 70–180. It is a fixed visual guide, not a setting. More in Changing 70 to 180.
- Purple-tinted shape around the dashed line: the forecast band. It starts at the NOW line and fans out. It shows how sure the app is, not where you will end up. More in Two shaded areas.
- Amber dot with a gram count. A meal and its carbs at that time (22g on the demo). More in The 22g dot.
- The time axis. 1PM, 2PM, NOW and +90M on the demo. The axis runs past the 60-minute forecast to leave room for the curve and its band.
- Insights, not medical advice. The line at the bottom, with an i button beside it. Endobits Companion shows patterns. Your CGM alerts, your meter and your care team stay the reference for any decision.
Two shaded areas, and which is which
Why. They are two different things. The light strip between the dashed 70 and 180 lines is the target band from the legend. The purple-tinted shape that fans out from NOW around the dashed line is the forecast band. The CONFIDENCE card lower on the same screen says how it is drawn: the band is sized from your own recent forecast error, so it tightens when you are steady and widens when you are not. A wide band means the app is less sure. It is not saying you will reach the top of it.
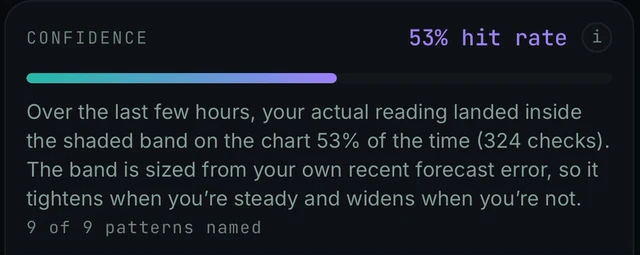
Today screen, scrolled down past the What if… card: the CONFIDENCE card explains the shaded band in the app's own words. Demo data.
Today → chart card → legend under the chart · Today → scroll down → CONFIDENCE → i
- Read the legend under the chart: solid teal line = observed, dashed purple line = trend preview, outlined box = target 70–180. The faint box between the dashed 70 and 180 lines is that target band.
- The shaded shape that starts at the NOW line and surrounds the dashed trend line is the forecast band. The CONFIDENCE card below the chart scores the forecast against it: over the last few hours, how often your actual reading landed inside the band (53% on the demo, from 324 checks).
- If the band looks very wide, your recent readings have been moving a lot. The band is sized from your own recent forecast error, so it tightens when you are steady and widens when you are not. Wide means less sure, nothing more.
- For the app's own explanation, scroll down to the CONFIDENCE card and tap its i button. The sheet it opens, titled How well we have actually been doing, says the score is measured against the band, not against the exact predicted number. More: 53% hit rate.
- There is also an i button at the bottom right of the chart card, next to Insights, not medical advice. We have not confirmed what it shows, so tap it for the app's own wording.
The 22g dot, and why your meals may be missing
Why. The amber dot with a gram value marks a meal and its carbs at that time on the chart. On the demo the meals are simulated. With your own data on iPhone, meals come from Apple Health: the store listing says the app reads glucose, meals, activity, sleep and workouts, read-only. So a meal appears only if an app on your phone wrote it to Apple Health and Endobits is allowed to read it. There is no meal-logging button in the app. On Android, our sources do not say whether real meals are read from Health Connect; the 5.1.2 notes only say that demo meals no longer appear next to real readings.
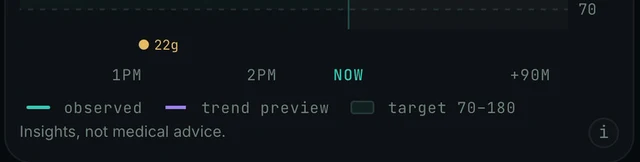
Today screen, bottom of the chart card: the amber 22g meal dot sits just above the time axis. Demo data.
Today → chart card · iPhone Settings → Privacy & Security → Health → Endobits
- Check which data you are looking at. If the banner at the top says DEMO DATA · TAP TO LEAVE and the chart card shows the DEMO chip with Demo data · simulated, the dot and everything else on the chart are simulated. Tap the banner to leave. More: Demo data or your data.
- iPhone: Endobits reads meals from Apple Health and cannot record one itself. Log the meal in an app that writes meals to Apple Health.
- iPhone: make sure Endobits can read from Apple Health. Open iPhone Settings, go to Privacy & Security, then Health, then Endobits, and turn on the data you want to share. Steps with screenshots: Connect Apple Health.
- Android: if your real meals are missing, tell us. Today → top-right icon → Settings → Report a problem, attaching diagnostics if you choose to. We have not confirmed whether meals are read from Health Connect in this version.
- The Light meal and Big meal chips under What if… are previews of the next hour from the app's digital twin. They do not log a meal and do not add a dot to the chart. More: What if… scenarios.
Changing the 70 to 180 target band
Why. In this version the band is fixed. The chart legend reads target 70–180 and the 5.1.2 release notes describe the card as having "a shaded 70–180 target band". We have not found a setting that changes it, so treat the band as a visual guide, not as your personal range.
Today → top-right icon → Settings → Report a problem
- Nothing to change in the app: the band is 70 to 180 mg/dL on every chart we have seen. In mmol/L the same range is 3.9 to 10.0, though we have not confirmed how the chart labels it after you switch the unit. More: Glucose units.
- Keep using the range your care team gave you. Your CGM or meter and its alerts stay the reference. The Endobits band is a visual guide only. Insights, not medical advice.
- If an adjustable band matters to you, tell us so we can count the request: Settings → Report a problem, or email contact@bioconscious.tech.
The LIVE, REPLAY and DEMO chip
Why. The chip at the top of the chart card says how fresh the data is. The store listing puts it plainly: every chart is labelled LIVE, REPLAY or DEMO, so you always know exactly how fresh your data is. DEMO means simulated data, and the card says so beside the chip. LIVE and REPLAY are the labels used for your own readings, and LIVE is the one to expect once current readings are flowing from your connected source. Our sources do not define REPLAY further; from the store wording it appears to mean the chart is showing your data but not live.
Today → chart card → chip, top left · Today → NOW → age under the number
- DEMO: you are in the demo. Tap the amber DEMO DATA · TAP TO LEAVE banner at the top of Today, then sign in and connect a source. More: Demo data or your data.
- REPLAY when you expected LIVE: look at the reading age under the NOW number (the demo shows MG/DL · 9 MIN AGO). A growing age means new readings are not arriving. Work through Readings late, stale or not syncing and No data or not updating.
- Still REPLAY with a fresh reading age? Tell us what the chip says and what the age reads: Settings → Report a problem.
The chart does not look like these screenshots
Why. The chart card with the shaded 70 to 180 target band, the NOW line and the legend, with NOW and the forecast side by side above it, arrived with the Today screen redesign in version 5.1.2. Builds 5.1.0 and 5.1.1 use the earlier layout. As of the October 2026 release notes, 5.1.2 was on TestFlight with App Store submission pending, and Android had a preview build only, so an older look is normal until your store delivers the update.
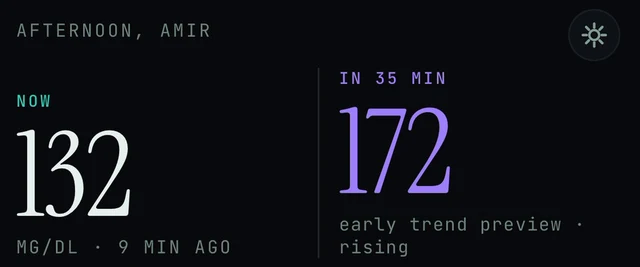
Today screen, top: the settings icon in the top-right corner opens Settings, where the app version is shown. Demo data.
Today → top-right icon → Settings
- Open Settings from the icon in the top-right corner of Today and find the app version. Since 5.1.1, Settings shows the build's real version; the exact label of that row is not confirmed, so look for a version number in the list. More: Settings and Report a problem.
- If the version is below 5.1.2, update the app from the App Store or Google Play once 5.1.2 is available there.
- If you are already on 5.1.2 and the chart card is still missing, use Settings → Report a problem and attach the diagnostics you choose.
Frequently asked
- What is the difference between the solid line and the dashed line?
- The solid teal line is what your sensor actually recorded ("observed" in the legend). It ends at the glowing dot on the NOW line, which is your current reading. The dashed purple line to the right of NOW is the trend preview, the app's view of the next hour, and it is redrawn as new readings arrive. The small hollow circle at its end is simply where the preview stops.
- What do the little "i" buttons do?
- They open short explanations inside the app. There is one next to "day 1 of 15 · learning your patterns", one at the bottom right of the chart card next to "Insights, not medical advice.", one next to DIGITAL TWIN on the What if… card, and one next to the CONFIDENCE hit rate. Our screenshots show the buttons but not every sheet they open, so tap them to see the app's own wording.
- Why is there a second dotted line on the chart?
- You have a What if… scenario selected. The scenario (for example WALK 20 MIN or BIG MEAL) is drawn as a second dotted line beside the purple trend preview, and a line under the chips shows the change, for example "peak ~144 instead of ~172". It is a preview from the app's digital twin, not a logged event. See What if… scenarios.
- The axis ends at +90M. Does the app forecast 90 minutes ahead?
- No. The store listing describes the forecast as 60 minutes, and the axis runs to +90M to leave room for the curve and its band. The horizon can grow as the app learns your patterns. Seeing hours ahead is the product direction, not what the chart shows today. See The forecast and the Confidence score.
- Can I see more than the last few hours?
- The chart card on Today shows the recent hours around NOW. For your history and the AGP-style view, open the TRENDS tab at the bottom of the app. See Reports and trends.
- Will the band and the lines look the same in mmol/L?
- Our screenshots only show the app in mg/dL, where the band edges read 180 and 70. The same range in mmol/L is 3.9 to 10.0. We have not been able to confirm how the chart labels the band after you switch the unit. See Glucose units.
Still stuck? We answer.
A person at Bio-Conscious reads every message. Tell us your phone model, your sensor, and what you see on the screen.
Real app screens · demo data. Endobits shows insights, not medical advice. Always follow your care team's guidance and your sensor's own alerts for treatment decisions.
More help: All support articles · Connect your sensor · Set up Endobits Companion