The forecast and the Confidence score, explained
Why the forecast says IN 35 MIN and not an hour, why it moves with every new reading, what check your CGM means, and what a 53% hit rate does and does not tell you.
The forecast says IN 35 MIN, not 60 and not hours, and the minutes keep changing
Why. Neither is a fault. The headline beside NOW is where the dashed trend preview turns. On the demo, the chart writes 172 at the peak of the dashed line, about 35 minutes after the NOW line, so the minutes follow the shape of the forecast, not a timer. The app's full horizon is 60 minutes. While the number is labelled early trend preview and the strip reads day 1 of 15 · learning your patterns, the app is still learning your days, and the store copy says the horizon grows as it learns. Hours ahead is where the product is going, not what day 1 shows.
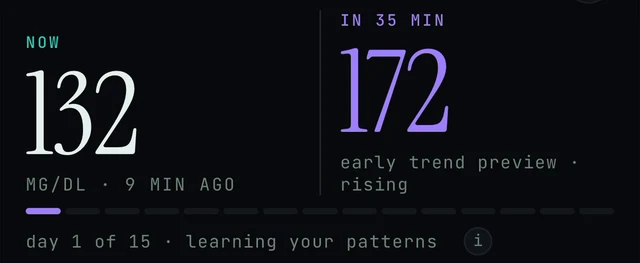
Today screen, just below the greeting: the NOW and IN 35 MIN numbers, and the learning strip with its (i). Demo data.
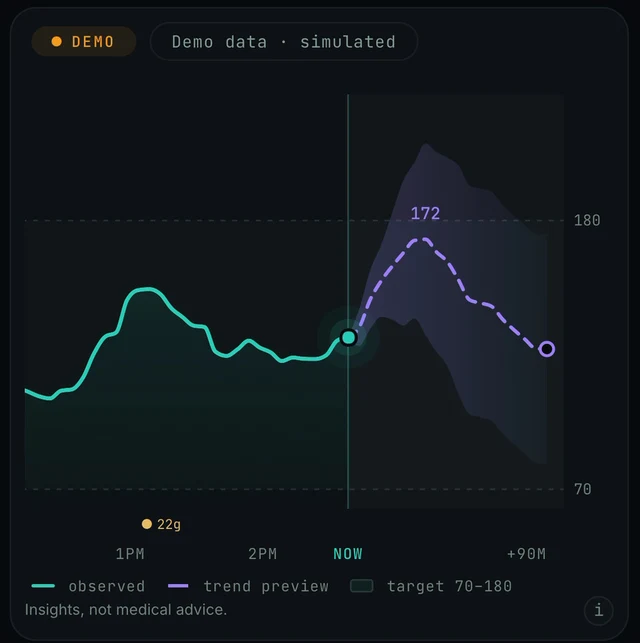
Today screen, the chart card under the numbers: the 172 label sits at the peak of the dashed trend preview, about a third of the way from NOW to +90M. Demo data.
Today → NOW / IN 35 MIN → day 1 of 15 strip → chart card · Today → scroll down → Your Curves → Name
- Check whether you are in the demo. If the amber DEMO DATA · TAP TO LEAVE banner is at the top of Today, every number on the screen is simulated. The demo always shows NOW 132 and IN 35 MIN 172, and its 15-day strip restarts on every demo visit, so it always reads day 1 of 15. Tap the banner to leave. More: Demo data or your data.
- Read the forecast as a curve, not a single promise. The chart card under the numbers draws the dashed purple trend preview from the NOW line out towards +90M, with a shaded band around it, inside the 70 to 180 target band. On the demo the 172 label sits at the peak of that line, about a third of the way to +90M. More on the card: Reading the chart.
- Look at the label under the forecast number and the strip under both numbers. While they read early trend preview and day 1 of 15 · learning your patterns, expect the forecast to change as the strip fills. The small i beside the strip, and the one on the chart card, give more detail in the app.
- Name your curves. Scroll down on Today to Your Curves. When a NEW SHAPE SPOTTED card appears, tap a suggested name (for example Lunch wave) or type one in Or name it yourself… and tap Name. The section says it plainly: the app forecasts further ahead as you do. More: Learning and your curves.
- Keep your sensor connected and the app syncing so the strip can fill. If readings stop arriving, see Connect your sensor and No data or not updating.
- Give the app its learning period (the strip counts 15 days) before judging how far ahead it reaches. Today the app shows about an hour ahead. Hours ahead is the product direction.
- Use the Confidence card to judge how much to trust the number. It is a measured hit rate over the last few hours, scored against the shaded band rather than the exact number, and it is allowed to go down. Insights, not medical advice: rely on your CGM alerts and your care team for decisions.
No forecast, just "check your CGM"
Why. This is by design, not a fault. Endobits never forecasts a low. When your readings run low, the forecast pauses and the app says check your CGM instead of a number. With the forecast paused there is nothing to draw, so expect no dashed line either. We have not confirmed the exact threshold, or where on the screen the message sits, so this section describes the behaviour rather than the pixel.
Today → forecast beside NOW · Today → top-right icon → Settings → Report a problem
- Look at your CGM or meter directly and follow its own alerts and the plan you have from your care team. Endobits gives insights, not medical advice, and will not tell you what to do here.
- Expect no number while readings are low. Endobits never shows a predicted low. The store listing calls the message "Check your meter"; since 5.1.1 it reads "check your CGM". We have not confirmed the threshold or when the forecast resumes, so give it a few new readings once your CGM shows you are back in range.
- If your readings are clearly back in range and a number still has not returned beside NOW, bring the app back to the foreground. On 5.1.2 and later (a TestFlight and Android preview build at the time of writing) Dexcom, Eversense and DIY rig connections refresh when the app returns to the foreground, not only at launch. On older builds, closing and reopening the app is a reasonable check.
- Still no forecast with readings in range? Open Settings (the top-right icon on Today) and use Report a problem, attaching the diagnostics you choose (5.1.2 and later). Or email contact@bioconscious.tech or call +1 (236) 235-5295. More: Settings and Report a problem.
The number and the dashed line changed after a new reading
Why. The newest one. The trend preview starts at the NOW dot on the chart and shows the next hour from where you are now and your recent pattern. It is a preview, not a fixed promise, so each new reading redraws it. A calibration (5.1.2 and later: tap the NOW number and enter a meter reading) also re-runs the forecast from the meter value, and a selected What if… chip adds a second line. The changelog states the redraw only for calibrations; that each sensor reading redraws the preview is our reading of the screens.
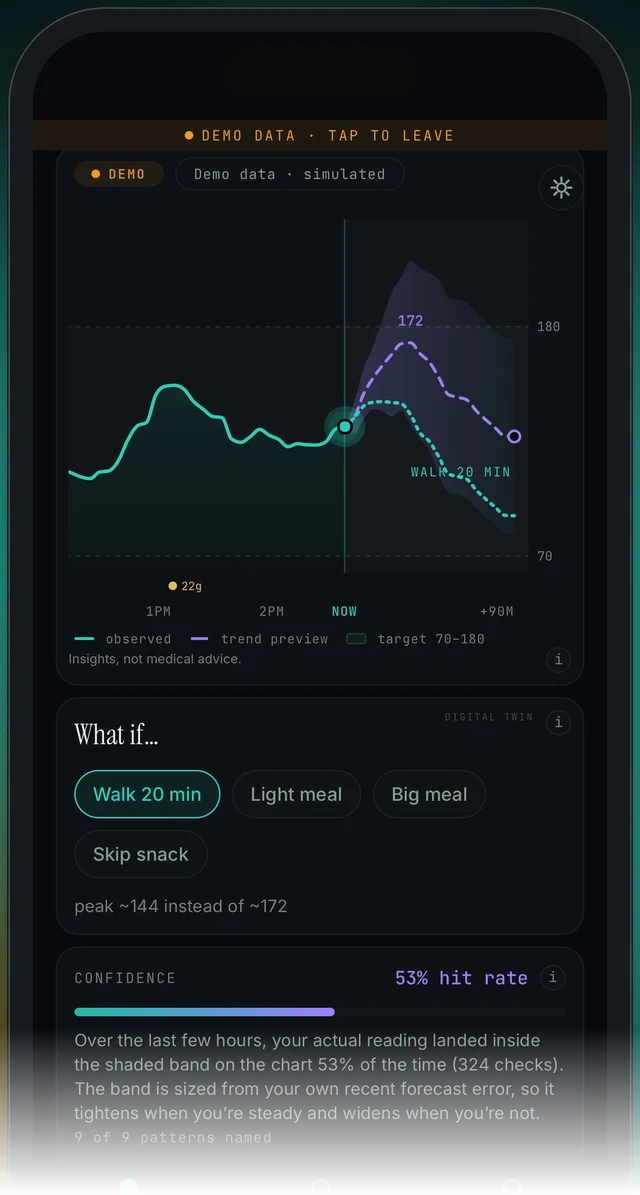
Today screen, scrolled down, demo data: the chart card (with the Walk 20 min scenario drawn as a second dotted line), then the What if… card, then the CONFIDENCE card. That is the card order on Today.
Today → NOW · 9 MIN AGO → chart card → legend → What if… chips → CONFIDENCE
- Look at the age under NOW (for example MG/DL · 9 MIN AGO). The dashed trend preview starts at the NOW dot on the chart, so a newer reading gives a newer preview. The newest one is the current preview.
- Check the chips under What if… (Walk 20 min, Light meal, Big meal, Skip snack). If one is highlighted, a second dotted line labelled with that scenario (for example WALK 20 MIN) is drawn beside the purple trend preview, and a line such as peak ~144 instead of ~172 appears under the chips. That is a scenario, not the forecast. The purple trend preview in the legend is the forecast. More: What if scenarios.
- Check the learning strip under the numbers (day 1 of 15 · learning your patterns). While it is still learning, the forecast is labelled early trend preview and will move around more.
- Scroll past the What if… card to the CONFIDENCE card. The hit rate (53% on the demo) is how often your actual reading landed inside the shaded band over the last few hours. The band is sized from your own recent forecast error, so it tightens when you are steady and widens when you are not. A high score means you can lean on the preview more; a low one means check your sensor more often.
- If your app is 5.1.2 or later (Settings shows the build's version) and you tapped the NOW number and entered a meter reading, that calibration is why the line jumped: the forecast re-runs from the meter value, keeping the sensor's own slope. Calibrations show as hollow rings on the chart. Later sensor readings are not altered. 5.1.2 is on TestFlight and Android preview at the time of writing, so store builds do not have this yet. More: Calibration.
- If the chart card is labelled DEMO (Demo data · simulated), the numbers are simulated and will not match anything you saw on a live chart. Tap the DEMO DATA · TAP TO LEAVE banner to leave the demo.
The forecast was wrong
Why. The dashed line is a trend preview, not a prediction to plan around. In the first days it is labelled early trend preview while the app is still learning your patterns (day 1 of 15). The horizon grows as the app learns your days and as you name your recurring curves. The honest measure is the CONFIDENCE card: how often your actual readings landed inside the shaded band recently. It is scored against the band, not the exact number, so 172 becoming 150 can still count as a hit if 150 was inside the band.
Today → scroll past the chart and What if… → CONFIDENCE → (i) · Today → scroll down → Your Curves → Name
- Open Today and scroll past the chart card and the What if… card to the CONFIDENCE card. It shows a hit rate (53% on the demo) and explains it: over the last few hours, your actual reading landed inside the shaded band on the chart that percentage of the time. A score near 50% means lean on the preview lightly.
- Tap the i beside the hit rate to read how the score is made (the sheet is pictured below). In the app's own words, the number is the audit, not a promise, and it is allowed to go down. Treat a high score as permission to lean on the forecast and a low score as a signal to check your sensor more often. Meals, exercise and illness all knock it around.
- Check the strip under the numbers. While it reads day 1 of 15 · learning your patterns, the forecast is labelled early trend preview and gets better as the app learns your days. On the demo the strip restarts at day 1 on every visit.
- Name your curves. Scroll down on Today to Your Curves (the store listing also mentions it with the Trends tab, so look there if your build differs). When NEW SHAPE SPOTTED appears, pick a suggested name or type your own and tap Name; the app forecasts further ahead as you do. More: Learning and your curves.
- Never act on the preview alone. Use your CGM or meter and your care team's plan. The chart card says Insights, not medical advice. for this reason. The app also never forecasts a low; when readings run low it pauses and says check your CGM.
Confidence shows 53%. Is the app right only half the time?
Why. The number is a measured hit rate, not a grade for the exact forecast number. The app replays its own forecast over your recent readings and counts how often your actual glucose landed inside the shaded band on the chart (on the demo, 324 checks over the last few hours). The band is sized from your own recent forecast error, so it tightens when you are steady and widens when you are not. The app says the score is allowed to go down. On day 1 of 15 the app is still learning your patterns and the forecast is labelled early trend preview, so a modest score early on is expected.
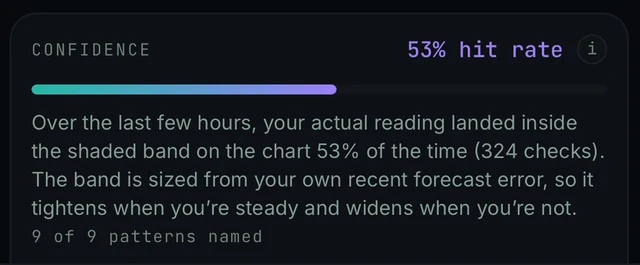
Today screen, below the What if… card: the CONFIDENCE card with the hit rate, the (i), the bar, the explanation and 9 of 9 patterns named. Demo data.
Today → scroll past the chart and What if… → CONFIDENCE → (i)
- Read the text on the CONFIDENCE card. It says what the percentage counts and over what period: over the last few hours, your actual reading landed inside the shaded band on the chart 53% of the time (324 checks).
- Tap the i beside the hit rate. It should open the full explanation, How well we have actually been doing, which confirms the score is measured against the shaded band, not against the exact predicted number, and only over the last few hours.
- Use the score the way the app suggests: a high score is permission to lean on the forecast, a low one is a signal to check your sensor more often. It moves with your day (meals, exercise and illness all knock it around). It is not an error to fix.
- Keep your sensor connected so the app has fresh readings to score against. The day 1 of 15 · learning your patterns strip under the NOW and forecast numbers shows how far along the app is. On day 1 a modest score is expected.
- If the score stays very low for days while readings are fresh, send a report: Today → top-right icon → Settings → Report a problem, and attach the diagnostics you choose.
Confidence dropped suddenly
Why. Nothing has to be broken. The score covers the last few hours only, and the app says that meals, exercise and illness all knock it around. A meal or a workout the forecast did not see makes the next few hours land outside the band. The band also tightens when you have been steady, so a sudden change after a calm spell is more likely to miss a narrow band. A sensor gap or an old reading can also drag it down.
Today → CONFIDENCE → (i) · Today → NOW · 9 MIN AGO
- Open Today and look at the CONFIDENCE card. Tap the i to read how the score works: it replays the forecast over your recent readings and counts how often your actual glucose landed inside the shaded band on the chart. The app says this number is allowed to go down.
- Think back over the last few hours. The app says the score moves with your day, and that meals, exercise and illness all knock it around.
- Treat a lower score the way the app describes it: a signal to check your sensor more often. Your CGM, meter and care team stay the reference. Insights, not medical advice.
- Check the age shown under NOW (for example 9 MIN AGO). If the reading is old or missing, fix the connection first (No data or not updating, Connect your sensor) so the app has fresh readings to score.
- Give it time. The score is scored over the last few hours only, and against the band, so it changes as new readings arrive.
- If it stays very low with fresh readings and no obvious reason, send a report: Today → top-right icon → Settings → Report a problem, and attach the diagnostics you choose.
The Confidence card shows no number, or you cannot find the card
Why. The card sits below the What if… card on Today, so it is easy to scroll past. The score comes from replaying the forecast over your recent readings, so it needs a few hours of fresh readings before it has anything to count. We have not confirmed what the card shows when there is no forecast to score (readings paused while low, a stale reading, or no sensor connected yet), so the steps below are the reasonable checks, not a confirmed cause.
Today → scroll below What if… → CONFIDENCE
- On Today, scroll down past the chart card and the What if… card. The CONFIDENCE card comes next and shows a percentage labelled hit rate (pictured in the scrolled Today screen above).
- The score is measured over the last few hours of your readings only (the card says it is scored over the last few hours only, and against the band). If you have just connected a sensor or just signed in, wait a few hours of live readings and look again.
- Check the age shown under NOW (for example 9 MIN AGO). If it is old or there is no reading, start with Connect your sensor or No data or not updating.
- If the app says check your CGM, forecasts are paused while readings run low. Follow your meter or CGM alerts and your care plan. Look at the card again once a forecast is showing.
- If the card still shows no number after that, send a report: Today → top-right icon → Settings → Report a problem, and attach diagnostics.
Finding the full Confidence explanation again
Why. The explanation is a sheet that slides up over Today. It is titled CONFIDENCE, How well we have actually been doing. The CONFIDENCE card has an i icon beside the hit rate, and tapping it is the expected way to open the sheet. The screens we work from show the card and the sheet but not the tap itself, so if the i does nothing on your build, tell us.
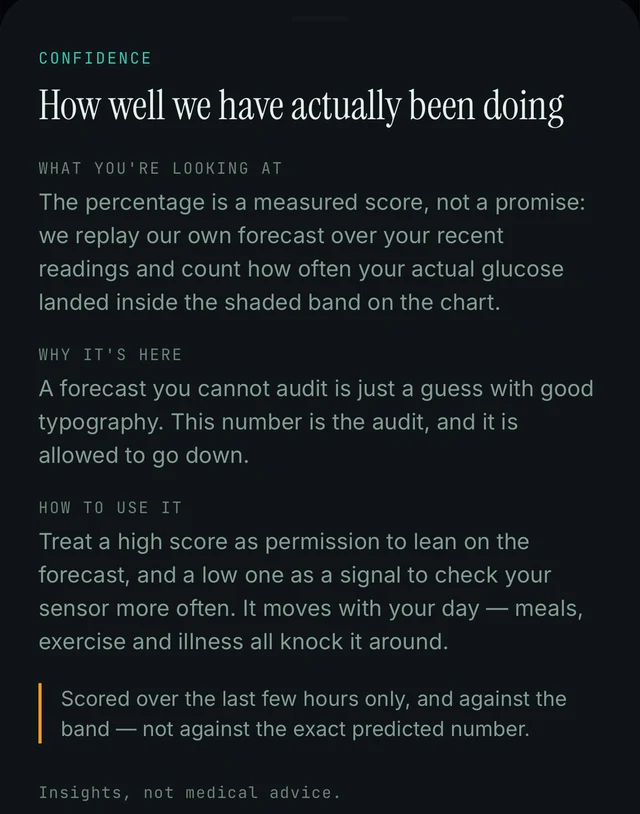
The CONFIDENCE sheet, slid up over the Today screen: the full explanation of the hit rate. Demo data.
Today → CONFIDENCE → (i)
- On Today, scroll down to the CONFIDENCE card. It shows the hit rate (for example 53% hit rate) and a short explanation underneath.
- Tap the small i on the right of the hit rate line. That should open the full explanation sheet.
- The sheet slides up over Today and is titled CONFIDENCE, How well we have actually been doing. It has three parts: WHAT YOU'RE LOOKING AT, WHY IT'S HERE and HOW TO USE IT, plus a note that the score covers the last few hours only and is measured against the shaded band, not the exact predicted number.
- The sheet has a handle at its top. Close it the way you close other sheets on your phone.
Confidence was high but the forecast still missed
Why. The score is measured against the shaded band, not against the exact predicted number, and only over the last few hours. A high score means your recent readings mostly landed inside the band; it is not a promise about the next reading. The app calls it a measured score, not a promise, and says to treat a high score as permission to lean on the forecast, not as a guarantee.
Today → chart card → shaded band · Today → CONFIDENCE → (i)
- Look at the shaded band around the forecast on the chart. The app scores hits inside that band, not against the exact predicted number, so the number can be off while the reading still landed in the band.
- Remember the window. The score covers the last few hours only, and meals, exercise and illness all knock it around. A recent change in your day can move things before the score catches up.
- Read the number as a measured audit, not a guarantee. The app says it is allowed to go down, and to treat a high score as permission to lean on the forecast and a low one as a signal to check your sensor more often.
- Keep using your CGM and meter for decisions. Every chart card says Insights, not medical advice.
- If forecasts keep missing badly while the score stays high, send a report with diagnostics: Today → top-right icon → Settings → Report a problem.
Frequently asked
- Is 172 the reading I will have in exactly 35 minutes, or the highest it will get?
- It is the peak of the trend preview and when that peak is expected: about 35 minutes from now, around 172. On the chart the same 172 is written at the top of the dashed line, and the What if… card uses the same idea when it says "peak ~144 instead of ~172". So the headline shows where the forecast turns, and the minutes change as the shape changes. The whole forecast is the dashed line on the chart.
- How far ahead does the app forecast?
- The app shows a 60-minute trend preview beside your current reading. During the first days it is labelled "early trend preview" while the app learns your patterns, and the horizon grows as it learns. Seeing hours ahead is the longer-term vision, not what the app shows today.
- The axis says +90M. Is the forecast 90 minutes?
- No. The store listing describes the forecast as 60 minutes. The chart's time axis runs to +90M to leave room for the curve and its band. The horizon can grow as the app learns your patterns and as you name your curves, but the app describes it as about one hour ahead.
- Does the app predict lows? Why not?
- No, and it says so. Endobits never shows a predicted low. When your readings run low, the forecast pauses and the app shows "check your CGM" (older builds and the store listing: "Check your meter"). Use your CGM's own low alerts and your care team's plan for anything about lows. This is different from the old Diabits app, which some people remember for 30-minute low warnings on a watch.
- Can I act on the forecast? Why does it say "Insights, not medical advice."?
- The chart card says "Insights, not medical advice." because Endobits Companion is a wellness app. It helps you see patterns. It is not a substitute for your meter, your CGM alerts or your care team, and it does not tell you what to do. For more than the few hours the chart shows, open the TRENDS tab at the bottom for your history and AGP: see Reports and trends.
- What is a "hit rate"? Is it the same as accuracy?
- No. The hit rate is the share of recent checks where your actual reading landed inside the shaded band around the forecast on the chart. It does not score whether the exact predicted number was right. "324 checks" is how many comparisons went into the score over the last few hours. The band is sized from your own recent forecast error, so it tightens when you are steady and widens when you are not.
- What does "9 of 9 patterns named" under the Confidence card mean?
- It counts how many of your recurring glucose curve shapes have been given a name in Your Curves. The store listing says naming your curves helps the forecast horizon grow as the app learns your days. In the demo all nine are named; on a fresh account expect a low count at first. We have not confirmed why the count sits on the Confidence card.
- Will the confidence score go up as the app learns me?
- Not in a straight line. The score is measured fresh over the last few hours, so it moves with your day, and the app says it "is allowed to go down". Separately, the learning strip ("day 1 of 15 · learning your patterns") tracks the app learning your days, and the listing says the forecast horizon grows with that. A better-learned forecast can land inside the band more often, but meals, exercise and illness will still knock the score around.
Still stuck? We answer.
A person at Bio-Conscious reads every message. Tell us your phone model, your sensor, and what you see on the screen.
Real app screens · demo data. Endobits shows insights, not medical advice. Always follow your care team's guidance and your sensor's own alerts for treatment decisions.
More help: All support articles · Connect your sensor · Set up Endobits Companion