What if… chips: what they change and how to undo them
Tapping Walk 20 min, Light meal, Big meal or Skip snack draws a labelled scenario line and changes the small line under the forecast, not the big number, and this page shows how to read a scenario and how to clear it.
Where the What if… chips are
Why. The chips live on the Today tab, below the chart card. On a phone the card starts near the bottom of the first screen, so part of it is cut off until you scroll. It looks the same in the light theme, and the demo has it too.
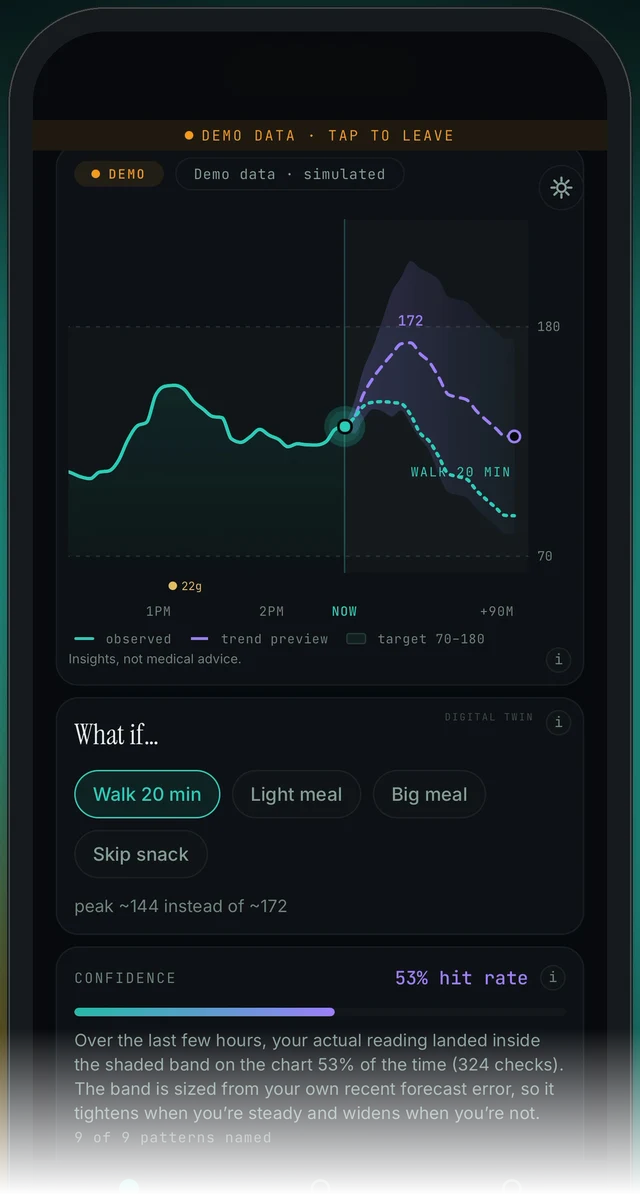
Today tab, scrolled down. The What if… card sits directly under the chart card and above the Confidence card.
Today → What if… card
- Open the Today tab (the left icon in the bottom bar, labelled TODAY).
- Scroll down past the NOW and IN 35 MIN numbers and past the chart card. On a phone the What if… card starts near the bottom of the first screen, so part of it may be cut off until you scroll.
- The What if… card has the small label DIGITAL TWIN and four chips: Walk 20 min, Light meal, Big meal and Skip snack.
- Tap one chip. The scenario is drawn as a second dotted line on the chart above (for example WALK 20 MIN or BIG MEAL), and a line under the chips shows the change (for example "peak ~144 instead of ~172").
Tapping a chip seems to do nothing
Why. When a chip is picked, three things change, and none of them is the big number. The chip turns teal. A second dotted line, labelled in capitals with the scenario name (WALK 20 MIN, BIG MEAL, SKIP SNACK), appears on the chart beside the purple dashed trend preview. The line under the chips reads something like "peak ~144 instead of ~172". If the scenario is only a little different from the trend, the two lines can sit close together, and the "peak" line is the clearest sign it worked. If none of the three signs appear, the tap may not have registered, or there is no fresh forecast to branch from: the NOW reading is old, or forecasts are paused because readings are running low.
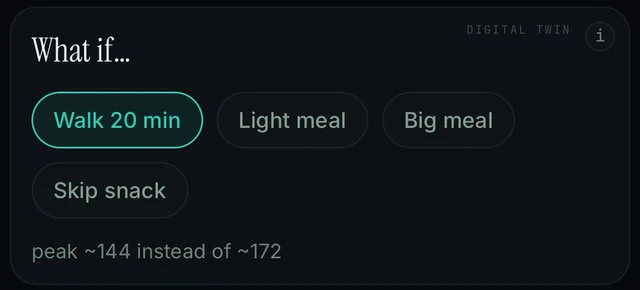
Today → What if… card, with Walk 20 min picked. The chip is teal and the line under the chips reads peak ~144 instead of ~172.
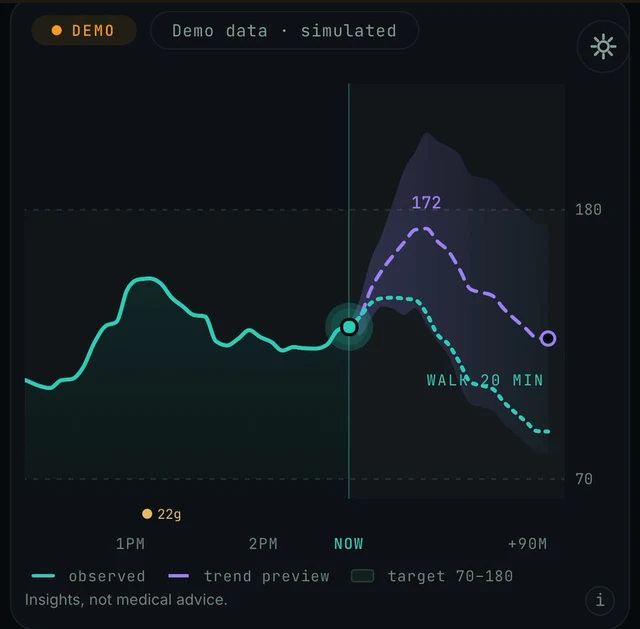
Today → chart card, with Walk 20 min picked. The purple dashed line is the plain trend preview. The dotted line labelled WALK 20 MIN is the scenario.
Today → What if… card → tap a chip
- On Today, scroll below the chart card to the What if… card and tap one chip. Check that it is highlighted (teal outline, as on Walk 20 min in the figure above).
- Look at the chart just above. The scenario is the dotted line labelled in capitals (for example WALK 20 MIN or BIG MEAL) next to the purple dashed trend preview line.
- Look under the chips for the comparison line, for example "peak ~144 instead of ~172". If it is there, the scenario is working even when the two lines look similar.
- Check the small line under the forecast number at the top of Today. With a scenario picked it reads, for example, "with big meal · ~209" instead of "early trend preview · rising".
- Scenarios branch from the forecast, so check that a forecast is showing at all. Look at the age next to NOW (for example "9 MIN AGO"). If it is much older than your sensor's normal interval, fix the data first: No data or not updating and Connect your sensor.
- If the forecast area says "check your CGM", forecasts are paused because readings are running low. Follow your CGM and meter; the app does not forecast a low. See Forecast paused below.
- If a chip still does nothing with a fresh reading and a forecast showing, send a report: open Settings from the top-right icon on Today, then Settings → Report a problem.
The big forecast number did not change
Why. The large IN 35 MIN number is always the plain forecast, and it stays put. The scenario shows in three other places: the small line under that number ("with big meal · ~209"), the labelled dotted line on the chart, and the "peak … instead of …" line under the chips. This is by design, so you can compare the scenario against the plain forecast.
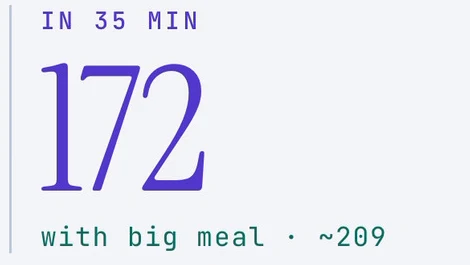
Top of Today, the forecast column to the right of NOW, with Big meal picked. The big number is still 172. The small line under it now reads with big meal · ~209.
Today → What if… card → tap a chip
- Pick a chip on the What if… card on Today (Walk 20 min, Light meal, Big meal or Skip snack).
- Read the small line directly under the IN 35 MIN number. With a chip picked it names the scenario and its estimated peak, for example "with big meal · ~209". With no chip it reads "early trend preview · rising".
- Compare the two lines on the chart: the purple dashed line is the plain trend preview (see the chart legend), and the dotted line labelled with your scenario, for example BIG MEAL or WALK 20 MIN, is the what-if. More on the legend: Reading the chart.
- Look under the chips for the comparison line, for example "peak ~144 instead of ~172" when Walk 20 min is picked. It shows the scenario peak next to the plain forecast peak.
How the plain forecast number is made, and what the Confidence card says about it: Forecast and confidence.
An extra dotted line appeared and the forecast says "with big meal · ~209"
Why. A What if… chip is selected. The chips are a digital-twin simulation. When one is highlighted, the chart draws the scenario as a second dotted line with its label, the forecast slot shows the scenario result (for example "with big meal · ~209"), and the card under the chart reads something like "peak ~144 instead of ~172". The dashed purple line is still your plain trend preview. Your forecast has not changed.
Today → What if… card → teal chip
- On Today, scroll to the What if… card under the chart (it carries a small DIGITAL TWIN label). One chip will be highlighted with a teal outline: Walk 20 min, Light meal, Big meal or Skip snack.
- That highlighted chip is why the chart shows a second dotted line with a label like WALK 20 MIN or BIG MEAL, why the forecast slot reads "with big meal · ~209", and why the card reads "peak ~144 instead of ~172". Your underlying forecast has not changed: the dashed purple line is still the trend preview, and 172 is still the forecast number.
- To go back to the plain forecast, deselect the chip: see Clear a scenario below. With no chip selected, the chart shows only the dashed purple trend preview and the forecast slot reads "early trend preview · rising".
- A scenario is a simulation of what a walk or a meal might do to the next hour. It is an insight, not medical advice, and not a suggestion to do that thing.
How to clear a scenario and get the plain forecast back
Why. Only one scenario is active at a time. The plain forecast has no chip highlighted; a scenario has exactly one chip highlighted. The screens on this page show no separate Clear or Reset control on the card, so the chip itself is where a scenario is switched off.
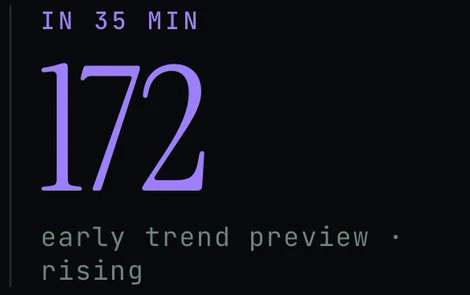
Top of Today, the forecast column with no chip picked. The small line reads early trend preview · rising. This is what a cleared scenario looks like.
Today → What if… card → teal chip
- Scroll to the What if… card on Today. The active scenario is the chip drawn in teal (for example Walk 20 min or Big meal); the other chips are plain.
- Tap the highlighted chip once more. If the line stays, tap another chip, check that the chart follows the new choice, then tap that chip again.
- You are back on the plain forecast when no chip is highlighted, the chart shows only the dashed purple trend preview with no scenario label such as WALK 20 MIN or BIG MEAL, the line under the forecast number reads "early trend preview · rising" rather than "with big meal · ~209", and the "peak ~144 instead of ~172" line under the chips is gone.
- If a scenario stays stuck no matter what you tap, send a report with diagnostics: open Settings from the top-right icon on Today, then Settings → Report a problem.
A scenario line goes above 180. Is the app warning me?
Why. It is a preview, not an alert and not a measurement. The digital twin shows how a big meal might shape the next hour, drawn against the 70–180 target band so you can see where it would land. The card is labelled "Insights, not medical advice." It does not tell you what to do about it, and the app sends no alerts of its own: push notifications are on the planned list, not in the app yet (Alerts, widgets and watch).
Today → What if… card → Big meal
- Read the scenario line as a what-if you asked for, not as a reading or a warning. The chart draws it as a dotted line labelled with the chip you picked (for example BIG MEAL) next to the purple trend preview, and the top of Today shows it as "with big meal · ~209" under the IN 35 MIN number.
- To compare scenarios, tap a different chip (Walk 20 min, Light meal, Big meal or Skip snack). The chart redraws for the chip you picked.
- For any decision, check your CGM or meter and follow the plan you agreed with your care team. Endobits is not a substitute for your meter, your CGM's own alerts, or your care team.
- Endobits never shows a predicted low. When readings run low, the forecast pauses and the app tells you to check your CGM. See Forecast paused.
Chips draw nothing while the forecast is paused ("check your CGM")
Why. By design the app never forecasts a low. When readings run low, the forecast pauses and the app says "check your CGM". The what-if preview branches off the forecast, so while the forecast is paused there may be nothing for a scenario to draw.
Today → NOW and IN 35 MIN · Today → What if… card
- Check your CGM or meter now and follow your care plan. The pause is on purpose: Endobits never shows a predicted low, so when readings run low the forecast pauses and the app says "check your CGM".
- While the forecast is paused, the what-if chips may not show a scenario line either. Nothing is broken. The pause is part of the app's design, not a setting.
- Keep using your CGM or meter as the reference. Once readings are no longer running low, look at the Today screen again to see whether the forecast and the chips are back.
- If the pause stays on while your CGM shows normal readings for a long time, send a report: open Settings from the top-right icon on Today, then Settings → Report a problem and attach the diagnostics you choose.
FAQ
- What does "peak ~144 instead of ~172" mean?
- ~172 is the highest point of the plain trend preview over the next hour. ~144 is the highest point the digital twin expects if you take the scenario you tapped (here, a 20 minute walk). The tilde means "about". Both are estimates, not readings, and the plain forecast number at the top of Today stays the same while you compare.
- What does DIGITAL TWIN mean on the What if… card?
- It is the app's model of how your glucose tends to respond, used to preview how a walk, a meal or a rest might shape the next hour. Tapping a chip asks that model a question and draws the answer on the chart as a labelled dotted line. It is a preview, not a reading, and not medical advice.
- Can I pick two scenarios at once, like a walk and a light meal?
- One at a time. The app shows one chip highlighted and one labelled line on the chart. Tapping another chip switches to that scenario instead of adding a second line. Combined scenarios are not something the app shows.
- Does tapping "Walk 20 min" tell the app I actually walked?
- No. The chip only previews what a walk might do to the next hour. It does not record an activity or change your history. One-tap activity labels with measured outcomes are on the planned list (version 5.3) and are not in the app yet.
- Will a scenario ever show me going low?
- No forecast in Endobits shows a predicted low. When readings run low, the forecast pauses and the app asks you to check your CGM. The what-if chips branch from that forecast, so they follow the same rule. Use your CGM's and meter's own alerts for lows.
Related: Forecast and confidence · Reading the chart · No data or not updating · Demo vs live data
Still stuck? We answer.
A person at Bio-Conscious reads every message. Tell us your phone model, your sensor, and what you see on the screen.
Real app screens · demo data. Endobits shows insights, not medical advice. Always follow your care team's guidance and your sensor's own alerts for treatment decisions.
More help: All support articles · Connect your sensor · Set up Endobits Companion